
Core Web Vitals & Site Speed
Core Web Vitals optimisation service for faster pages on phones
Our Core Web Vitals optimisation service fixes the speed problems your visitors feel on their own phones, judged by their data, not a test-tool score.
Proposed change
ExampleHomepage headline
- Loads fast on phones
- Clear call button
- Quote form works
- Easy to read
In every planIncluded in Local or Growth, from $149 a month. Every plan has every feature; they differ by size.
Compare plansWhat the metrics mean
The three Core Web Vitals and what each one measures
Each of the three Core Web Vitals matches something people complain about, which makes them worth fixing even with search set aside.
Largest Contentful Paint answers "how long until the page looked loaded?" It measures when the largest element on screen finished loading, usually a main image, a heading or a block of text. It depends mostly on how fast your server responds and how early the browser finds that key file.
Interaction to Next Paint answers "did it respond when I tapped?" It measures the delay between a tap, click or key press and the next visible change on screen, across the whole visit. This is where JavaScript-heavy sites get caught: the page loads fast, then feels stuck because every tap waits behind other work in the browser.
Cumulative Layout Shift answers "why did it move while I was reading?" It measures unexpected movement of content on screen. Common causes are images without set sizes, fonts swapping, banners added above the content, and cookie notices that push the page down just as someone goes to tap a link.
Google’s thresholds
What counts as a good score, and how Google measures it
These are Google’s published thresholds and measurement rules. Each figure links to the official documentation.
- Largest Contentful Paint at or below this is rated good
- 2.5s
- Source: web.dev: Largest Contentful Paint
- Interaction to Next Paint at or below this is rated good
- 200ms
- Source: web.dev: Interaction to Next Paint
- The point in your page loads where each threshold is checked
- 75th percentile
- Source: web.dev: Web Vitals
- The rolling window the Chrome UX Report uses to gather field data
- 28 days
- Source: Chrome UX Report documentation
Two details matter most. The first is the 75th percentile: Google judges you not on the average visit but at the point where three quarters of visits are faster and a quarter slower. Averages hide the slow visits this rule protects.
The second is the 28-day rolling window. A fix made today will not fully show in Search Console for about a month, so we set up speed tracking in your own analytics to show within days whether it worked.
Field data and lab data
Field data and lab data answer different questions
Most arguments about site speed come from mixing these two up. One tells you what your visitors experienced. The other helps you find out why.
| Dimension | Field data (from visitors) | Lab data (simulated tests) |
|---|---|---|
| What it is | Measurements from visits on people’s own devices and networks | A simulated page load on a set device and a slowed connection |
| Where it comes from | The Chrome UX Report, and your own speed tracking if you have it | Lighthouse, the lab section of PageSpeed Insights, WebPageTest and similar tools |
| Best used for | Deciding whether there is a problem and who it affects | Finding the cause, with a trace you can follow |
| Blind spot | Shows what happened but not why, and lags behind your changes | Cannot represent your visitors, their devices or their networks |
| INP coverage | Captures taps and clicks across the whole visit | Cannot measure it properly, because simulated tests do not click and tap like visitors |
| When they disagree | This is the one that reflects your business | Use it to form ideas to check, and do not treat it as the final word |
Diagnosis
How to tell whether you have a speed problem
Most arguments about site speed come from acting on the wrong measurement. These three questions show whether there is a problem, which one it is, and whether you will be able to tell when it is fixed.
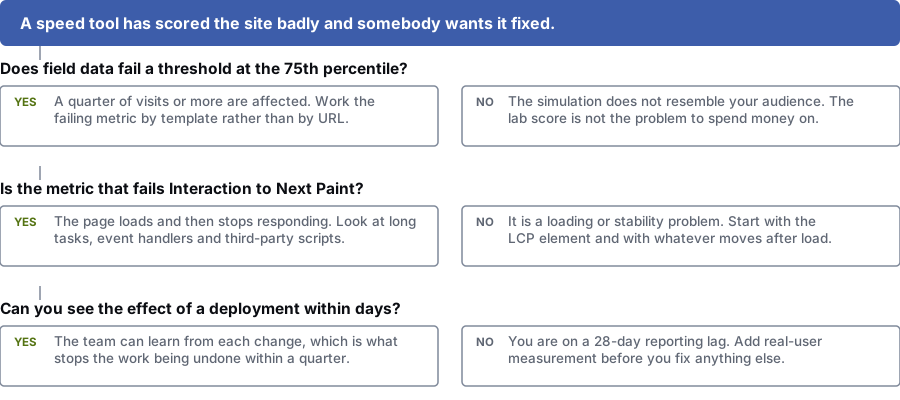
Does field data fail a threshold at the 75th percentile?
Yes: At least a quarter of visits are affected. Fix the failing metric one template at a time.
No: Your visitors do not match the simulation. The lab score is not worth spending money on.
Is the failing metric Interaction to Next Paint?
Yes: The page loads and then stops responding. Look at long tasks, event handlers and third-party scripts.
No: It is a loading or layout problem. Start with the LCP element and anything that moves after load.
Can you see the effect of a change within days?
Yes: Your team can learn from each change, which stops the gains being lost within a few months.
No: You are waiting on a 28-day lag. Add your own speed tracking before you fix anything else.
What we do
What our Core Web Vitals optimisation covers
We fix problems one template at a time. Ten thousand slow product pages are one problem with one fix. Treating them as ten thousand problems is how these projects stall.
- A review of visitor speed data by template, device type and country, so we fix what affects your visitors
- Finding the LCP element on each template, then fixing what delays it: server response, blocking files, late-loading images and fonts
- INP diagnosis through long-task profiling, event handler cost, hydration and third-party scripts
- Layout fixes: set sizes for images and video, a font loading plan and reserved space for anything added after load
- An audit of third-party tags, with the measured slowdown and a recommendation for each
- An image plan: formats, responsive sizes, priority hints and what needs to load first
- Less JavaScript, because shipping less code is the most dependable way to make a page respond faster
- Speed tracking in your own analytics, so you can see the effect of changes within days
- A written performance budget, plus a rule for who can add to the page and when
Keeping the gains
Why sites get slow again after speed work
The technical fixes are the easier half. Sites usually slow down again because of how teams work together, not because of the engineering.
- Two teams, one page, no shared budget.
- Developers speed up the build. Marketing adds tags through a tag manager with no review. Neither sees the combined effect until the field data moves a month later, and by then nobody knows which change caused it. A performance budget with a clear owner is the fix that lasts.
- The team worked on the score.
- Effort goes into the parts of a lab score that are cheap to move, and the parts visitors feel stay the same. You get a better number, the same experience and no change in field data.
- New features are added without a speed check.
- A carousel, a chat widget, a reviews embed, a personalisation script. Each one makes sense alone. Together they are why the site is slow. Without a rule that each addition’s speed cost is measured first, the result is predictable.
- Nobody is tracking speed day to day.
- If you rely only on Search Console, you wait 28 days after each change to see whether it helped. Teams cannot learn at that pace, so they stop trying. Speed tracking in your own analytics cuts the wait to days.
Questions
Common questions about Core Web Vitals and site speed
What are LCP, INP and CLS measuring?
Loading speed, response speed and visual stability. Largest Contentful Paint (LCP) records when the largest visible element, usually the main image, a heading or a block of text, finishes loading. It stands in for "when did the page look loaded?"
Interaction to Next Paint (INP) measures how quickly the page visibly responds to a tap, click or key press across the whole visit. Cumulative Layout Shift (CLS) measures how much visible content moves unexpectedly while the page loads.
What is the difference between field data and lab data?
Field data comes from real visits on people’s own devices and connections. The Chrome UX Report gathers it, and Google uses it for the Core Web Vitals report in Search Console.
Lab data comes from a simulated device and network, as in Lighthouse and most speed tools. It is great for finding causes, because you can repeat the test and follow a trace, but it does not measure what your visitors experience.
When the two disagree, trust the field data and use the lab tools to find out why.
We have a Lighthouse score of 98. Do we still need this?
Maybe not, but check your field data first. A high lab score on a fast simulated connection shows the page can be fast. It does not show whether it is fast for someone on a three-year-old Android phone on a busy mobile network.
The score is also a weighted mix of measures, so it can stay high while a metric your visitors feel, usually INP, fails.
How much does site speed affect rankings?
Less than most people selling speed work suggest. Google has said consistently that page experience is one signal among many, and that useful content usually outranks faster but less relevant content.
The stronger reason is sales and cost. Slow pages lose visitors before they see anything, and with paid ads you have already paid for those visitors. So we treat speed as a way to win more business, with rankings a smaller bonus.
Our tag manager is the problem. What do we do about it?
Measure the cost of each tag, then agree who approves new ones. Most sites carry tags for tools nobody uses any more.
Then set rules: who approves a new tag, what evidence they need and what the performance budget is. Without them, the tags come back within six months and the gains are lost.
How long before improvements show in Search Console?
About a month. Search Console uses field data from a rolling 28-day window, so a change made today will not fully show for about a month, even if it worked at once.
Your own speed tracking shows the change within days, which is a main reason to set it up: you are not waiting on Google’s reports to know whether a fix worked.
Find out whether your site has a speed problem
We will review your field data by template and tell you which metric is failing, which visitors it affects and what a fix would take. Sometimes your lab score is misleading you and the site is fine.
Prefer to talk it over? Book a free call
References
Sources for core web vitals optimisation service
The official documents and research this page is based on. Platform rules change, so check the source before you act on a detail.
Related
More on core Web Vitals & speed
- why website quotes differ so widelyWhy ten quotes for the same brief can differ tenfold.
- technical search fundamentalsSpeed is one part of wider technical SEO work.
- a website redesignThe cheapest time to fix a deep-rooted speed problem.
- speed tracking and reportingSo you can see improvements in your own data, as well as in Google’s.
- a full technical audit
- organic search services
Where core Web Vitals & speed matters most
More web design & development services
Last updated · Published by Zubair Afzal, responsible editor