
Measurement
What is a good conversion rate? How to set your own baseline
Published by Zubair Afzal, responsible editor
First published Updated 10 min read
There is no single good conversion rate, because a conversion rate divides one number by another, and every business defines both numbers for itself.
Your own baseline is more useful than a borrowed benchmark. A benchmark tells you where you sit against businesses you know nothing about. A baseline tells you when something changed in your own business, the only conversion rate question that leads to decisions worth making.
Why benchmarks mislead
Three reasons conversion rate benchmarks don’t apply to you
Conversion rate benchmarks fail for three reasons, and any one is enough. The first is who is in the sample. Nearly every published benchmark comes from the customers of the analytics vendor, platform or agency publishing it. They differ from other businesses in size, skill, sector and traffic mix, so averaging them gives an accurate number about a group you aren’t in and can’t inspect.
The second is the bottom half of the ratio, usually sessions. A session is a setting, not a natural unit. By default, Google Analytics ends a session after thirty minutes of inactivity, and you can change that timeout. Journeys across domains, cookie consent, bot filtering and excluding your own staff all change the count too, so two businesses whose visitors behave identically can report different rates.
The third is the top half. What counts as a conversion is a choice. One business counts every form submission, including recruiters and suppliers; another counts only enquiries its sales team qualified; a third counts newsletter signups. Ad platforms can count a conversion once per click or every time it happens. A table that averages these is averaging things that can’t be compared.
Why the comparison fails
Both halves of a conversion rate depend on your settings
Two businesses whose visitors behave the same can report different conversion rates, because someone chose every setting below.
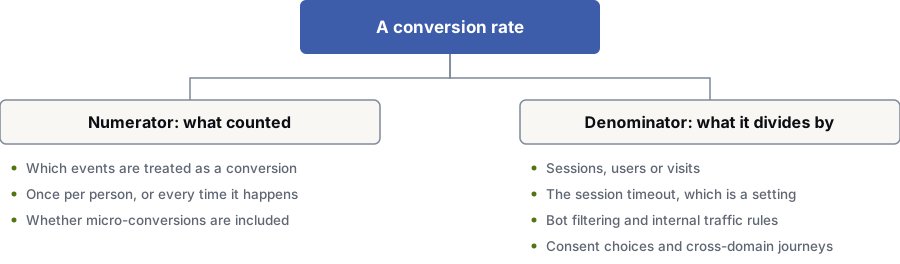
Top half: what counts as a conversion
- Which events are treated as a conversion
- Once per person, or every time it happens
- Whether small actions like signups are included
Bottom half: what it divides by
- Sessions, users or visits
- The session timeout, which you can change
- Bot filtering and rules for your own traffic
- Cookie consent and journeys across domains
Checking a benchmark
Six questions to ask before you use a conversion rate benchmark
If a source can’t answer all six, you can’t compare its number with yours. It is the minimum a fair comparison needs.
Use these on the next benchmark someone shows you, including any we might publish one day.
- Who is in the sample, and how did they get there? The publisher’s customers aren’t a fair sample of your sector.
- How many businesses and sessions is the figure based on? A median across eleven accounts and one across eleven thousand can both be quoted; only the second tells you much.
- What exactly is the bottom half of the ratio: sessions, users, visits or something else, and set up by whom?
- What exactly is the top half? Which events counted as a conversion, and were they counted once per visitor or every time?
- What period does it cover, and does it include a peak season? A figure that spans a promotional quarter describes that quarter.
- Can you filter it to a segment like yours? Device, channel, country and page type all move the rate more than sector does.
The method
How to set a conversion rate baseline from your own data
Five steps and no new tools: an afternoon to set up and a year of patience.
Write down both definitions
Write one sentence for the top half: exactly which events count, and whether once per person or every time. Write one for the bottom half: which sessions are in, which are out, and the session timeout. Until both are written down, two people in your business will calculate the rate differently and both will be right.
You get: A one-paragraph definition, kept where the report is built
Choose your segments before you look at any numbers
Decide up front which splits you will hold steady; channel, device, country and page type move a rate most. Choose after seeing the data and you end up with a segment that exists only because it looked good. Pick splits that match decisions you might take.
You get: A fixed list of segments, agreed before the first report
Use a time window that covers your buying cycle
Pick a window long enough to cover a full buying cycle and collect a fair number of conversions, for most businesses a rolling ninety days. A calendar month is too short: even the weekday a bank holiday falls on can visibly move it.
You get: A rolling time window, stated on the report
Report a range instead of a single number
Work out the rate for each of your last several windows and note the range it moved within while nothing important changed. That range is your baseline. A single number tempts people to react to normal movement inside the range, the most common way a conversion figure does harm.
You get: A range for each segment, with the period it was based on
Decide what change triggers a closer look
Agree in advance what would make you investigate, such as a move outside the range lasting a set number of windows in a segment that matters, and write it down. Without an agreed trigger, every review meeting reargues whether this month is worth worrying about.
You get: A written trigger for each segment, with a named owner
The maths
How much your conversion rate can move by chance
A conversion rate estimated from a sample has a standard error: the square root of p times one minus p, divided by n. These are worked examples of that formula. They aren’t measurements of any business.
- Approximate 95% interval around a 2% rate observed over 1,000 sessions
- ±0.9 points
- Source: NIST/SEMATECH e-Handbook of Statistical Methods, §7.2.4
- The same interval once the window contains 10,000 sessions
- ±0.3 points
- Source: NIST/SEMATECH e-Handbook of Statistical Methods, §7.2.4
- Default inactivity timeout after which Google Analytics starts a new session
- 30 minutes
- Source: Analytics Help: about Analytics sessions
At a two per cent rate over a thousand sessions, the true rate could easily be anywhere from about 1.1 to about 2.9 per cent. A month at 2.0 and a month at 2.7 fit with nothing having changed at all.
Ten times the sessions narrows the interval by about a factor of three, because the error shrinks with the square root of the sample. That is why so much conversion reporting at low traffic is opinion more than evidence.
The bottom half of the rate is a setting. Change the session timeout, fix tracking across domains or start excluding your own staff, and the rate moves with no change in visitor behaviour. After a change like that, set a new baseline and label the old range as belonging to the old setup.
What to compare against
Four things to compare your conversion rate against
Only two of these support a decision. The other two are widely used, which is why they are here.
| Dimension | Is the comparison fair? | What it costs you | What it can support |
|---|---|---|---|
| Your own past, same segment | Yes, as long as your definitions and tracking didn’t change in between. | Nothing beyond the discipline of keeping the segment and window fixed. | Almost every decision worth making: whether something changed, and when it started. |
| Your own segments against each other | Yes for finding where a problem is. No for judging whether a level is acceptable. | A little analysis time. You already have the data. | Setting priorities. Which channel, device or page template is holding you back, and which is fine. |
| A published industry benchmark | Almost never. Who is in it, and what was counted on each side of the ratio, all differ or go unstated. | Free at first. The cost comes later, when someone turns it into a target. | Nothing safely. At best, a very rough idea of the scale for a category. |
| A competitor set you measured yourself | Yes in principle, since you set the definitions. Almost nobody can get the data. | High. You need figures your competitors have no reason to share. | Claims about your position you can defend, in the rare cases the data exists, such as regulated disclosures. |
What goes wrong
Four ways conversion rate benchmarks cost you money
The common ways a borrowed number does damage, and why this guide has no benchmark table.
- A number from an article became a target in a board paper.
- Once a figure is written into a plan, nobody asks where it came from. Teams chase a number based on businesses unlike yours, and activity that would bring in more revenue at a lower rate gets turned down because it makes the metric look worse.
- The tracking changed but the baseline didn’t.
- A new cookie banner, fixed cross-domain tracking, a new counted event or a changed session timeout each moves the rate without any change in how visitors behave. Leave the old range in place and someone ends up blamed for a settings change.
- Two periods with different traffic mixes were compared as if they were alike.
- A quarter with a brand campaign brings in different visitors from a quarter without one, so the blended rate measures the mix of visitors, not the site. Compare within a fixed segment, chosen before anyone looks at the numbers.
- A supplier was judged on a figure that was never comparable.
- Measuring an agency or internal team against a published average built on different definitions punishes work that raised lead quality while lowering volume, and rewards counting something easier as a conversion. If a rate will judge performance, agree the definitions in writing first.
Next steps
What to read once you have a conversion rate baseline
If your conversion rate is low
If you don’t trust the number
Questions
Conversion rate questions
So what is a good conversion rate?
There is no universal good conversion rate. A conversion rate divides one number by another, every business defines both numbers differently, traffic comes in different ways, and published figures rarely say what period they cover.
Ask instead: is your rate better or worse than the same segment of your own traffic last quarter, and is the difference bigger than the normal noise? That question has a clear answer.
Why can’t I just use an industry benchmark?
Because you can’t see the three things that would make the comparison fair. The businesses behind the figure are usually the publisher’s own customers, not a sample of your sector. The number of visits depends on how each business sets up sessions, and the number of conversions on what each decided to count.
A benchmark becomes usable if the source states who is in it, how they were chosen, exactly what was counted on both sides, and the period, and lets you filter to a segment like yours. Very few published tables state even two of those.
How much traffic do I need before the number means anything?
Enough that the margin of error is smaller than the change you care about. The standard error of a proportion is the square root of p times one minus p, divided by the number of sessions; the ninety-five per cent interval is about twice that either side.
At a two per cent rate over a thousand sessions, that interval is about nine tenths of a percentage point either way. To detect smaller changes, you need more sessions or a longer window.
Our conversion rate went up after traffic fell. Is that good?
The rate alone can’t tell you. If the traffic you lost was people who were never going to buy, you get the same enquiries from fewer visits and nothing was lost. If it was buyers, the rate went up while the business got worse.
That is why enquiries and revenue belong on the same chart as the rate. A rate can rise because conversions went up or because visits went down; only the first is worth celebrating.
What should we report to the board instead of a benchmark?
A range instead of a single figure, with the segment, time window, definition and the number of enquiries or orders underneath. For example: paid search, mobile, form submissions, rolling ninety days, currently inside the range set over the previous year.
Add one line saying what would trigger a closer look, such as a move outside the range lasting a set period. The number becomes a warning light, which is all it can reliably be.
Do you publish conversion rate benchmarks?
No. We don’t have a dataset we could stand behind, and our editorial policy says every figure needs a primary source that states its population and period.
If we ever run a study big enough to publish, it will come with its method, its sample and its limits, and it still won’t replace your own baseline.
References
Sources for good conversion rate
The official documents and research this page is based on. Platform rules change, so check the source before you act on a detail.
- Analytics Help: about Analytics sessions
- Analytics Help: about key events
- Analytics Help: about data thresholds
- Google Ads Help: about conversion counting options
- NIST/SEMATECH e-Handbook of Statistical Methods, §7.2.4: proportions and the binomial distribution
- Analytics Help: set up cross-domain measurement
Related
Keep reading on good conversion rate
Start here
Set your baseline before anyone sets a target
Half an hour with your analytics is usually enough. We agree the definitions with you, choose the segments and show you how much the rate moves by chance.
Rather check it yourself? Try our free SEO tools