
Measurement
Marketing attribution models explained, with a worked example
Published by Zubair Afzal, responsible editor
First published Updated 8 min read
An attribution model doesn’t find out which channel caused a sale. It applies a rule for sharing credit among the touchpoints that were recorded.
So no model is more "true" than another in the way people usually mean. Choosing between them is more like choosing an accounting convention.
They are still useful. They let you compare channels, force you to be consistent, and show patterns you wouldn’t spot by eye. Use a report for the questions it can answer and set it aside for the ones it can’t.
The data each model gets
What data an attribution model works with
No model shares out the whole journey, only the part that survived three filters before the rule ran.
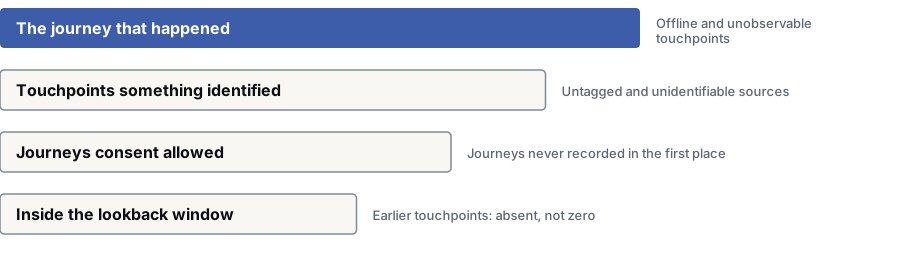
- 1The full buying journey — Every conversation, advert, referral and search that moved the buyer, including the ones nothing could have recorded.Offline touchpoints and anything else unseen
- 2Touchpoints that were identified — A tagged campaign link, a referring site or a recognised search source. These get grouped into channels by a rule someone set up or accepted as the default.Untagged sources and ones that can’t be identified
- 3Journeys consent allowed — Cookie consent decides whether a journey is recorded at all. So the data is already incomplete before anything is shared out.Journeys that were never recorded
- 4Inside the lookback window — How far back a touchpoint can be and still count. Anything earlier is missing from the data. It isn’t given zero credit. It is just not there.Earlier touchpoints: missing, with no credit at all
How the data is filtered
How touchpoints are recorded and filtered before attribution
Every model gets the same input: recorded journeys, each a list of timestamped touchpoints ending in a recorded outcome. Those touchpoints exist because something identified them, such as a tagged campaign link, a referring site or a recognised search source, and were grouped into channels by a rule someone set up or accepted as the default.
The lookback window decides how far back a touchpoint can count; cookie consent decides whether a journey was recorded at all; reporting thresholds can hide detail on small segments. The smaller the slice you look at, the more likely it is incomplete, and nothing tells you.
For a business with a short online path and clean tagging, the recorded part is most of the story. Where the deciding conversation happened at a trade show or on a phone call, it is a small share, and the model still divides it up with complete confidence.
Types of attribution model
The six marketing attribution models compared
Each rule carries an assumption about how people buy, and the assumption is what you sign up to when you pick one.
| Dimension | The rule | The assumption it makes | When it makes sense |
|---|---|---|---|
| Last click | All credit goes to the last recorded touchpoint before the sale. | That the last thing before the purchase is what caused it. | Quick, single-visit buying, and as a consistent baseline everyone understands. |
| First click | All credit goes to the first recorded touchpoint in the window. | That discovery is what matters, and everything after it would have happened anyway. | Judging activity meant to build awareness. Read it alongside another model, never alone. |
| Linear | Credit is split evenly across every recorded touchpoint. | That every touch mattered equally. That is almost certainly false, and the model makes no secret of it. | A neutral starting point when nobody can justify another split, and for seeing which channels are involved at all. |
| Time decay | Touchpoints closer to the sale get more credit, on a curve set by a half-life. | That influence fades over time, so recent contact matters more. | Considered purchases with a known sales cycle, where you can set the half-life from actual deal lengths. |
| Position-based | A large fixed share goes to the first and last touch. The rest is split across the middle. | That discovery and closing matter most, and the middle touches play a supporting role. | Longer journeys where different teams run the first and last steps. |
| Data-driven | Credit is estimated by comparing paths that led to a sale with paths that didn’t. | That each touchpoint’s contribution can be worked out from the difference between the two groups. | Accounts with enough data for the comparison to be stable, and teams willing to trust a rule they can’t check by hand. |
Worked example
Attribution models compared on the same journeys
This is a made-up example and measures nothing. It shows how each rule works: the same journeys and the same result give six different pictures of which channel did what.
| Dimension | Organic, day 21 | Paid social, day 14 | Email, day 7 | Brand search, day 0 |
|---|---|---|---|---|
| Last click | 0 conversions | 0 conversions | 0 conversions | 100 conversions |
| First click | 100 conversions | 0 conversions | 0 conversions | 0 conversions |
| Linear | 25 conversions | 25 conversions | 25 conversions | 25 conversions |
| Time decay | About 6.7 | About 13.3 | About 26.7 | About 53.3 |
| Position-based | 40 conversions | 10 conversions | 10 conversions | 40 conversions |
| Data-driven | Can’t be worked out from one path | Can’t be worked out from one path | Can’t be worked out from one path | Can’t be worked out from one path |
Limits
Four attribution problems no model can fix
These come with attribution itself, so switching models never solves them.
- Touchpoints nobody recorded.
- A recommendation from a colleague, a podcast mention, a chat at a conference or a link shared in a private message often decides the purchase and appears in no journey. The more of the journey happens offline, the more precisely the model describes a small share of what happened.
- Consent and thresholds thin the data unevenly.
- Journeys are only recorded when a visitor allows it, and reporting systems can hide detail on small segments to protect privacy. Neither effect is spread evenly across channels or audiences, so the surviving data is already skewed.
- Your systems disagree on what a conversion is.
- Platforms use different lookback windows; some count every conversion and some one per click; some report modelled conversions where they couldn’t see a direct link. You can’t make models agree while the counting rules differ. Knowing those rules is the only way to make sense of the gap.
- No model tells you what would have happened otherwise.
- Every model tells you which channels were present. None tells you what would have happened if a channel hadn’t run, which is what every budget decision asks. Only a holdout test can answer it.
Good practice
How to use attribution models without being misled
None of this needs new software, just someone to write things down and stick to them.
- Choose one model as your reporting standard and name it on every report.
- Treat a model change as a scheduled event. Restate your history, reset your targets and tell everyone who has a number in a plan.
- Read a second model alongside your standard one, without averaging them. The gap shows which channels come early in the journey and which come late.
- Write the lookback window on the report. A thirty-day window and a ninety-day window give different histories for the same activity.
- Check total attributed conversions against what your business recorded. Publish the gap openly.
- Keep a view with no model applied: raw channel sessions and raw enquiries, with no credit shared out. It warns you when a model change is doing something odd.
- Ask customers how they heard about you, and treat their answers as a separate, imperfect source rather than forcing them to match your data.
Questions
Attribution model questions
Which attribution model should we use?
Use a model you will stick with and your leadership team can understand, and reset your targets against it when you adopt it. Consistency matters more than sophistication, because the report is most useful for comparing one period with another.
If people buy quickly, often in one visit, last click is simple and easy to defend. If the journey is long with many touchpoints, a position-based or data-driven model describes it better. Neither makes your data more complete.
In Google Analytics 4 or Google Ads you have fewer options. Google’s documentation says the first click, linear, time decay and position-based models were removed from Analytics in November 2023 and are no longer supported in Google Ads, leaving data-driven and last-click variants. The other rules are still used by other tools and spreadsheets.
Is last click attribution bad?
No, but it is narrow. It answers one fair question precisely: which channel was the last recorded touch? The trouble is that people read it as which channel caused the sale.
Channels late in the journey then look efficient and channels that create demand look wasteful. If last click is your reporting standard, say so in the commentary, or someone discovers the bias during a budget cut.
How does data-driven attribution work?
Data-driven attribution compares paths that led to a sale with paths that didn’t, and estimates each touchpoint’s share from the difference. There is no fixed split, so you can’t work out its results by hand from a single journey.
That makes it easier to defend statistically than a fixed rule, and much harder to explain. It needs plenty of data, and its results shift as the data shifts.
Why do our numbers change when we switch models?
Because the model is the rule that produced the numbers. Change the rule and your history changes with it, often by a lot for channels early in the journey.
The common mistake is switching without resetting targets, budget splits and sometimes commission plans set under the old rule. Plan the switch as a scheduled event with your history restated, never a settings change someone makes on a Tuesday.
Where do offline and word-of-mouth influence appear?
Nowhere. No model can give credit to a touchpoint that was never recorded, and the conversation that decided the purchase usually happened somewhere no tracking tag can reach.
State this limit in every report. If much of your business comes from referrals or offline influence, treat attribution as a partial view and rely more on holdout tests and asking customers directly.
References
Sources for marketing attribution models
The official documents and research this page is based on. Platform rules change, so check the source before you act on a detail.
Related
Keep reading on marketing attribution models
Start here
Choose the right attribution model for your reporting
The right model depends on how your customers buy and what your leadership team needs to explain. Talk it through with our specialists before your next model change rewrites a year of history.
Want to see how your own site stacks up? Get my free SEO audit