
SEO
Core Web Vitals explained: what LCP, INP and CLS measure
Published by Zubair Afzal, responsible editor
First published Updated 8 min readWe check this page every three months. Next check: .
The three metrics
What are Core Web Vitals? The three metrics explained
Each metric matches something a visitor might say out loud. Think of them that way and the reports get easier.
LCP: “it took ages to show up”
Largest Contentful Paint measures how long the biggest thing on screen takes to appear, usually a hero image, heading block or banner. It often isn’t the element your team thought mattered most.
INP: “I tapped it and nothing happened”
Interaction to Next Paint measures how fast the page responds. It reports a value nearly all interactions came in under. Only clicks, taps and key presses count. It covers the wait before handling the input, the handling itself, and the wait for the screen to update.
CLS: “it moved while I was reading”
Cumulative Layout Shift measures the biggest burst of unexpected movement while the page is open. A burst is shifts less than a second apart, capped at five seconds in total. Late images, pop-in banners and web fonts are the usual causes.
The targets
Core Web Vitals thresholds and the 75th percentile rule
These four figures are the whole test.
- LCP target: the largest visible element should appear within this time
- 2.5s
- Source: web.dev: Largest Contentful Paint
- The percentile of page loads all three metrics are judged at, split by device
- 75th
- Source: web.dev: Core Web Vitals
To pass, three quarters of real visits must beat the target. So your slowest visits decide the result: older phones, weak connections, busy devices. Speeding up the page for your fastest visitors changes nothing.
How pages are judged
Where the data comes from, and why some pages have none
Core Web Vitals data comes from real Chrome users, not a test, which explains almost every clash between a green test score and a failing report.
Not every page gets measured on its own. The Chrome UX Report documentation sets two conditions:
1. The page or origin must be publicly discoverable, judged much like search indexing.
2. It must be popular enough to report on without identifying anyone.
Pages with a non-200 status, or a noindex instruction in a header or meta tag, aren’t eligible.
If a page doesn’t qualify, its visits still count towards your whole-site figures: the documentation says eligible visits across all pages of a discoverable origin are combined at origin level. So a template you’ve never looked at can make a page you’ve already sped up read as failing.
Query parameters and fragments are removed, so a landing page and its twenty tagged versions count as one page.
Missing data
Why your page may have no field data
“No data available” isn’t a pass or a fail. Here’s how to find which condition you missed in about a minute.
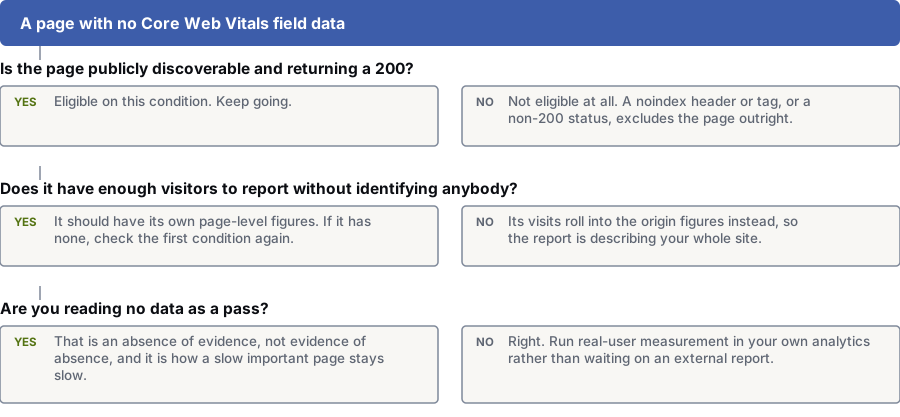
Is the page publicly discoverable and returning a 200?
Yes: It meets this condition. Go to the next question.
No: It isn’t eligible at all. A noindex header or tag, or a non-200 status, rules it out.
Does it get enough visitors to report without identifying anyone?
Yes: It should have its own figures. If it doesn’t, check the first condition again.
No: Its visits go into your whole-site figures. The report is describing your site.
Are you reading no data as a pass?
Yes: Missing data proves nothing. This is how a slow, important page stays slow.
No: Good. Set up real-user measurement in your own analytics so you’re not waiting on a report.
Metric by metric
What LCP, INP and CLS record, and how to improve each
Each metric has different causes. That’s why one round of speed work often fixes one and leaves two.
| Dimension | LCP | INP | CLS |
|---|---|---|---|
| What it records | How long the largest visible element takes to appear, from the start of loading. | How fast the page responds, as a value nearly all interactions came in under. | The biggest burst of unexpected movement, as a score, not a time. |
| When it’s recorded | Once, while the page loads. | Throughout the visit, whenever someone clicks, taps or types. | For as long as the page is open, even long after it loads. |
| What the visitor sees | A blank or placeholder screen for longer than expected. | A tap that seems to do nothing, so they tap again. | Text or a button jumping just as they reach for it. |
| Most common cause | A slow server, files that block the page, or a large unoptimised hero image. | Long tasks on the main thread: heavy event handlers, hydration, third-party scripts. | Images and embeds with no reserved space, late banners and font swaps. |
| What improves it | A faster server, loading the largest element first, and serving it at a sensible format and size. | Less JavaScript, shorter tasks, and removing or delaying third-party tags. | Set sizes on images and video, space reserved for late content, and fonts that don’t shift text. |
| Where lab tools mislead | A simulated connection can be faster or slower than your real visitors’. | A lab test doesn’t click or tap, so it can only estimate. | Lab tests mostly see shifts during loading. A page that jumps on scroll can look fine. |
Reading the report
Four common mistakes when reading the report
- The performance score is treated as the result.
- A score out of a hundred summarises lab measurements, several of which aren’t Core Web Vitals. It helps you diagnose, but it’s not what Google assesses. A page can score in the nineties and fail, or score poorly and pass.
- Only the homepage was tested.
- Your homepage is usually your most polished page and your least typical. The pages that make money are product, article or location templates. Check each template on pages that get visits.
- “No data available” is read as a pass.
- It means the page doesn’t qualify for its own report, usually because too few people visited. Treating it as a pass is how a slow landing page goes unchecked for a year.
- The fix went live, the report didn’t move, so the fix was called a failure.
- The report covers a period of real visits, so it changes slowly. To know sooner, measure the metrics in your own analytics on live traffic; you’ll get an answer in days.
Before you spend developer time
Six things to check before you start speed work
Speed work is expensive and easy to aim wrong. These six checks often shrink the job.
- Which templates the failing pages use, and how much traffic and revenue each brings. Fixing a template nobody visits earns nothing.
- Which of the three metrics is failing, per template and device. Their fixes have almost nothing in common.
- What the largest visible element is on each failing template. It’s often not the one your design treats as the hero.
- What each third-party script costs. Measure each tag’s main-thread time, then decide with whoever asked for them which tags stay.
- Whether the page has its own field data, or you’ve been reading whole-site figures as if they were one page.
- Whether real-user measurement runs in your own analytics. Without it, you wait on an outside report to see if changes helped.
Questions
Core Web Vitals: common questions
What are Core Web Vitals?
Core Web Vitals are three measurements of how a page feels to use. Largest Contentful Paint measures loading. Interaction to Next Paint measures responsiveness. Cumulative Layout Shift measures visual stability.
Each matches a visitor’s complaint: “it took too long to appear”, “I tapped it and nothing happened”, “it moved while I was reading”. That’s why Google judges them on real visits, not a test.
What counts as passing?
A page passes when it meets all three targets at the 75th percentile, according to web.dev. The targets are 2.5 seconds for LCP, 200 milliseconds for INP and 0.1 for CLS.
All three must pass, measured separately for mobile and desktop. Two out of three isn’t a pass, and neither is a good average; the percentile exists because averages hide the bad visits.
Why does our page have no field data?
Because it doesn’t meet the conditions for its own data. The Chrome UX Report documentation says a page or origin must be publicly discoverable and popular enough. Pages with a non-200 status or a noindex tag don’t qualify.
You’re then usually looking at figures for your whole site. Check that before deciding a page is failing.
Why does Lighthouse disagree with Search Console?
They measure different things. Lighthouse runs one simulated visit and gives a weighted score. Search Console sums up what real visitors experienced on their own devices.
When they disagree, real-visit data counts. Use the lab score to find the cause and real-visit data to see if the fix worked.
Does scrolling count towards INP?
No. According to web.dev, INP only counts clicks, taps and key presses. Scrolling and hovering don’t count.
INP reports a value nearly all interactions came in under. For most sites that’s the slowest one; pages with many interactions get one outlier per fifty ignored. So one very slow tap on a quiet page can set the whole number.
How much does this affect our position in search?
Only a little. Google documents Core Web Vitals as one part of page experience, among many signals, and says consistently that useful content matters more.
The stronger case is sales. A page that loads slowly on a mid-range phone loses visitors before they can buy, which you can see in your own analytics.
Our visitors are mostly on desktop. Does this still matter?
It matters less, but check your data first. Google judges mobile and desktop separately, so a desktop audience is judged on desktop visits.
Two warnings. Analytics misses many mobile visitors who left before the page worked, so your split may already reflect the problem. And desktop targets are the same numbers as mobile, so a heavy web app can fail on a good computer.
References
Sources for core web vitals explained
The official documents and research this page is based on. Platform rules change, so check the source before you act on a detail.
- web.dev: Core Web Vitals
- web.dev: Largest Contentful Paint (LCP)
- web.dev: Interaction to Next Paint (INP)
- web.dev: Cumulative Layout Shift (CLS)
- Chrome UX Report documentation
- Google Search Central: understanding Core Web Vitals and Search results
- Google Search Central: Core Web Vitals and page experience
Start here
Want to know which template is slowing you down?
Often two or three templates cause most of the problem. Our specialists can help you find them before you spend any developer time.
Rather check it yourself? Try our free SEO tools