
AI search
Do AI Overviews reduce clicks? What the click-loss evidence shows
Published by Zubair Afzal, responsible editor
First published Updated 8 min readWe check this page every three months. Next check: .
Why figures disagree
Five reasons AI Overviews click-loss figures disagree
AI Overviews click-loss figures disagree because they measure different searches, people and periods. Few have a method you can check, and the most shared are often tied to a product launch.
- The samples describe different groups.
- A panel study measures what a group of people did across all their searches. A keyword study measures click-through rates for a list of terms someone picked. They aren’t two estimates of one number, and splitting the difference describes no real set of searches.
- Nobody allows for which searches get an AI Overview.
- AI Overviews appear far more often on informational searches than on navigational or buying searches. So comparing searches with and without an overview mostly compares two kinds of search: part of the difference comes from the feature, part from how people behave when looking something up.
- The keyword lists are picked by hand.
- Most research from tool vendors starts with the keywords that vendor already tracks, which lean towards valuable commercial terms agencies pay to monitor. It isn’t a random sample, so the result is an average of that list alone.
- The periods are short, and the product keeps changing.
- A few weeks of data captures one version of a product whose frequency, layout and link prominence change all the time. A figure from last spring may describe a page that no longer exists.
- Only one party has the full data, and it has an interest.
- Google can measure this exactly and hasn’t published the data; everyone else works from outside with partial information. That doesn’t make either side wrong, but every number in this debate comes with an incentive, including the numbers that suit agencies.
One study in detail
What the Pew Research Center study measured
Pew used browsing data from 900 US adults, collected in March 2025 and published in July 2025. The limits follow the figures.
- Visits with an AI summary where a user clicked a traditional search result
- 8%
- Source: Pew Research Center, July 2025 (900 US adults, March 2025 browsing data)
- Visits with no AI summary where a user clicked a traditional search result
- 15%
- Source: Pew Research Center, July 2025 (900 US adults, March 2025 browsing data)
- Visits where a user clicked a source link inside the AI summary itself
- 1%
- Source: Pew Research Center, July 2025 (900 US adults, March 2025 browsing data)
We use this study because its method is published and its authors state its limits. It covers 900 adults, one country and one month, and it compares visits, not the same search shown two ways.
The third figure deserves the most thought. Where a summary appeared, people followed a source link inside it on about one visit in a hundred. Being named in an answer may have some value, but on this evidence it mostly doesn’t arrive as a visit.
Reading the study
What the Pew study proves about click loss, and what it doesn’t
The Pew study shows that, for this panel in this month, visits with an AI summary led to fewer website clicks. If the answer sits above the results, fewer people need the results.
It doesn’t prove how big the effect is. AI Overviews appear more often on informational searches, so part of the gap between 8% and 15% comes from the type of question asked. Separating the two would mean showing the same search to similar people with and without the feature, which only the platform can do.
It says nothing about commercial searches, which matter most to most businesses. We know of no published research we trust that isolates those searches properly.
It is also one month, in one country, from one panel. Repeated measurement over time would tell you far more, and nobody outside the platform is in a position to do it.
So the sentence you can defend in a business plan is narrower: informational searches appear to be losing clicks, the size of that effect isn’t settled, and our own exposure can be measured from our own data.
The Pew study and Google’s position compared
They are often presented as if they clash, but they mostly measure different things.
| Dimension | Pew Research Center | |
|---|---|---|
| What is claimed | Clicks on search results were less frequent on visits with an AI summary than on visits without one. | Total organic clicks from Search to websites have been broadly stable year over year, and the clicks are of higher quality. |
| What was measured | The share of visits that led to a click, split by whether a summary appeared. | Total clicks across all searches, with no breakdown by type of search. |
| Sample and period | Browsing data from 900 US adults, March 2025, published July 2025. | Google’s own full data. The scope, definitions and figures behind the statement weren’t published. |
| Independence | A non-partisan research organisation with no product in this market. | The company that runs the product being assessed, replying to critical coverage. |
| What it can’t tell you | How much the summary itself caused, what happens on commercial searches, anything outside the US, or whether the effect has grown since. | Whether any type of search, site or query is down. A stable total can hide big shifts underneath. |
| How to use it | As a data point you can cite, with its sample and period in the same sentence. | As evidence against the most extreme claims. It isn’t evidence that your informational pages are fine. |
A quick check
Five questions to ask about any click-loss statistic
You don’t need to read the whole study. These rule out most figures in about two minutes.
- Who produced it? Do they sell a product that looks more valuable if the number is alarming?
- What is the sample? How many searches, sites or people, and were they picked or randomly sampled?
- What period does it cover? How long ago was that, for a product that changes every month?
- Does it compare the same search with and without the feature, or two different sets of searches?
- Does it separate informational searches from commercial ones? If not, which kind makes up your traffic?
The debate about one global click-loss figure matters less than it seems. The only number that can change your plans is your own, and it is already in Search Console.
Group your queries by type and compare impressions with clicks over a period long enough to rule out seasonal swings. Where the two lines move apart shows your own risk, which beats an average of someone else’s keyword list.
If the gap appears on definition and how-to searches but not on product, location or brand searches, that is the common pattern. The response is to move budget calmly, not to panic.
Using your own data
What your Search Console data can and can’t show
Your Search Console data can show where clicks fell, but it can’t show that an AI Overview caused it. It still beats quoting someone else’s average. Be clear about which half was measured and which half was inferred.
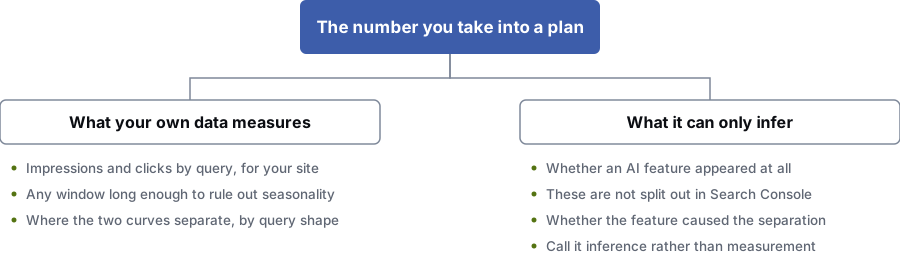
What your own data measures
- Impressions and clicks by query, for your site
- Any period long enough to rule out seasonal swings
- Where the two lines move apart, by type of search
What it can only infer
- Whether an AI feature appeared at all
- AI features aren’t split out in Search Console
- Whether the feature caused the gap
- Report it as an inference
Questions
Common questions about AI Overviews and click loss
What is the most reliable figure available for AI Overviews click loss?
The Pew Research Center study published in July 2025 is the most open to inspection that we know of. It used browsing data from 900 US adults, collected in March 2025. People clicked a traditional search result on 8% of visits where an AI summary appeared, and on 15% of visits where none appeared.
It is a proper measurement with its method published, but it is 900 people, one country and one month, and it compares visits, not the same searches. Quote it with those limits attached.
Why do the published numbers differ so much?
They measure different things but get quoted as if they measured the same thing. One counts what a panel of people did across all their visits; another compares average click-through rates for a chosen list of keywords; another looks at one industry.
Each is fine on its own terms. Average them and you get a figure that describes no real group of searches.
Can Google’s statement and the studies both be true?
Yes, and that is the most likely reading. Google said on its Search blog in August 2025 that total organic clicks from Search to websites were relatively stable year over year. Most of that total comes from navigational and commercial searches, which are much less affected than question-style searches.
So a big drop in informational searches can sit inside a stable total, which won’t reassure anyone who publishes mainly definition pages.
Should I quote any of these numbers in a business case?
Quote your own numbers. Search Console shows impressions and clicks by query for your site, and the pattern that matters is impressions holding while clicks fall on question-style searches.
If you must use an outside figure, pick one whose sample and period you can state in the same sentence, and state its limits in the next.
Does Search Console tell me when an AI Overview appeared?
No, not as a separate breakdown. Google’s AI features documentation says this traffic is included in the Search Console Performance report under the Web search type. It isn’t split out, so you can’t filter to it.
You can group queries by type and pages by template, then look at where clicks and impressions move apart. That is an inference, and should be described as one.
References
Sources for AI overviews click loss
The official documents and research this page is based on. Platform rules change, so check the source before you act on a detail.
Related
Keep reading on AI overviews click loss
- will AI replace SEO?The bigger question these figures are often used to answer.
- working out why organic traffic droppedThe cause is often not what people assume.
- recovering from a traffic drop that has already happened
- how we decide which figures to publish
- why quoted answers change the click
- measuring your visibility inside AI answersThe other half of the picture: being named, as well as being clicked.
- AI search work that starts from your own data
Start here
Get your own click-loss figure
We will split your Search Console data by type of search and page template, and show you where clicks and impressions have moved apart, with the full working and no single score.
Rather check it yourself? Try our free SEO tools